
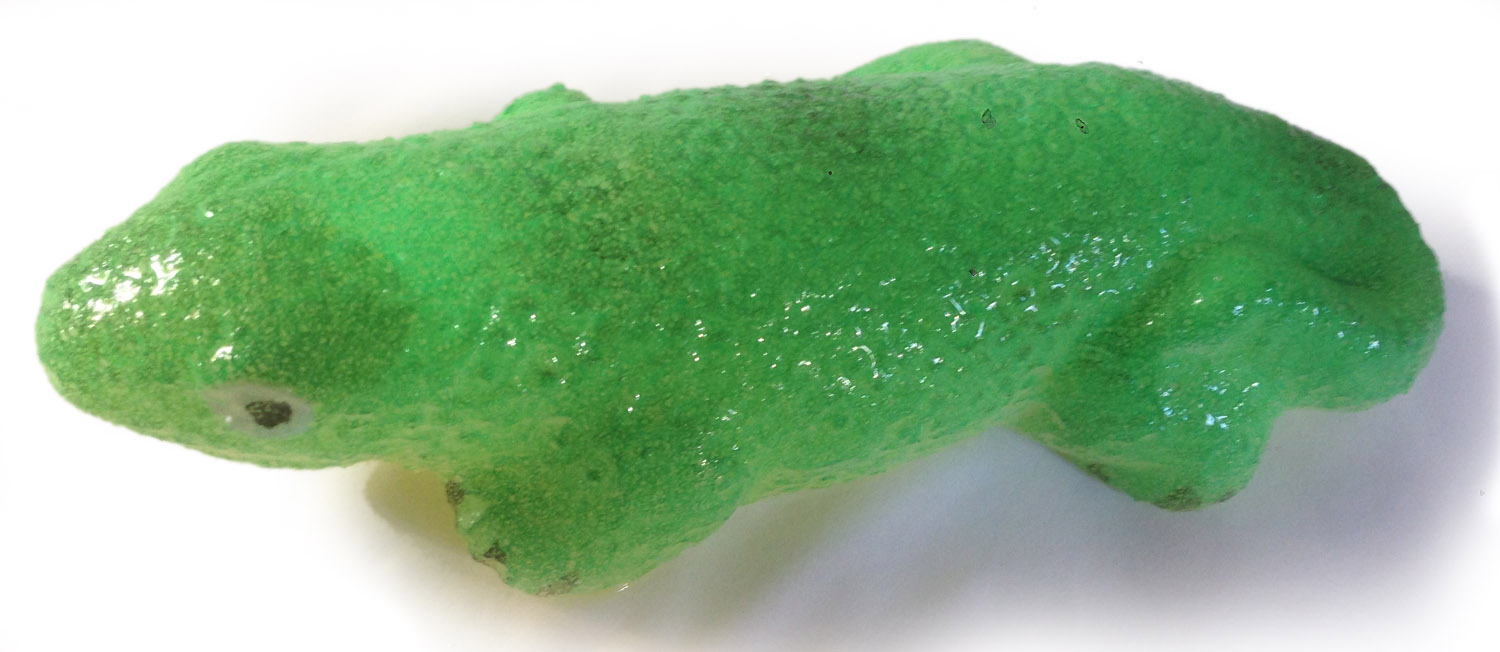
Here is George the Lizard Thing who has been lying in a vat of water growing for most of January:
And here is Herbie’s chart of George’s growing progress:
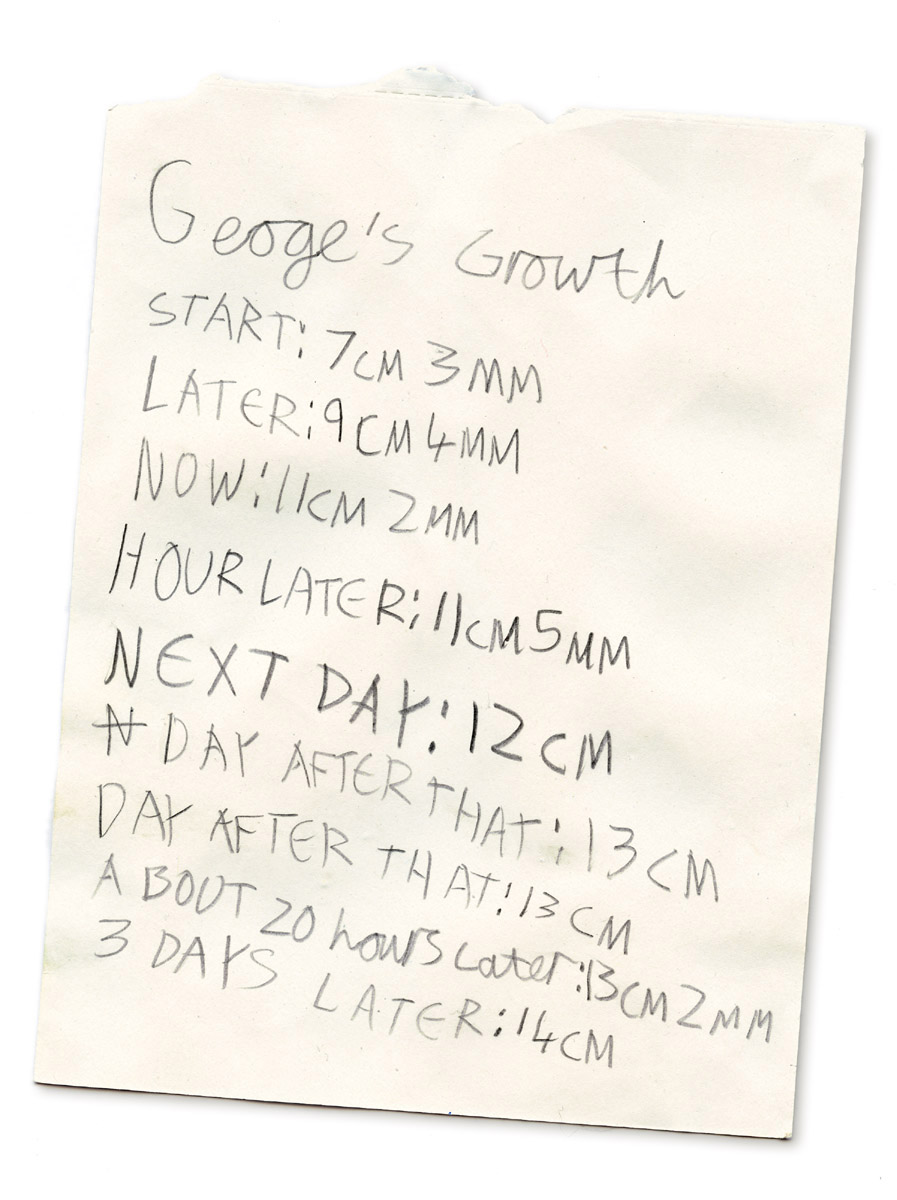
The challenge: use this information to make a graph and determine the lizard-thing’s rate of growth.
Plotting the temporal axis looks looks problematical.